Westhaven Gold Corp.
1056 - 409 Granville Street
Vancouver, B.C. Canada V6C 1T2
info@westhavengold.com
Details
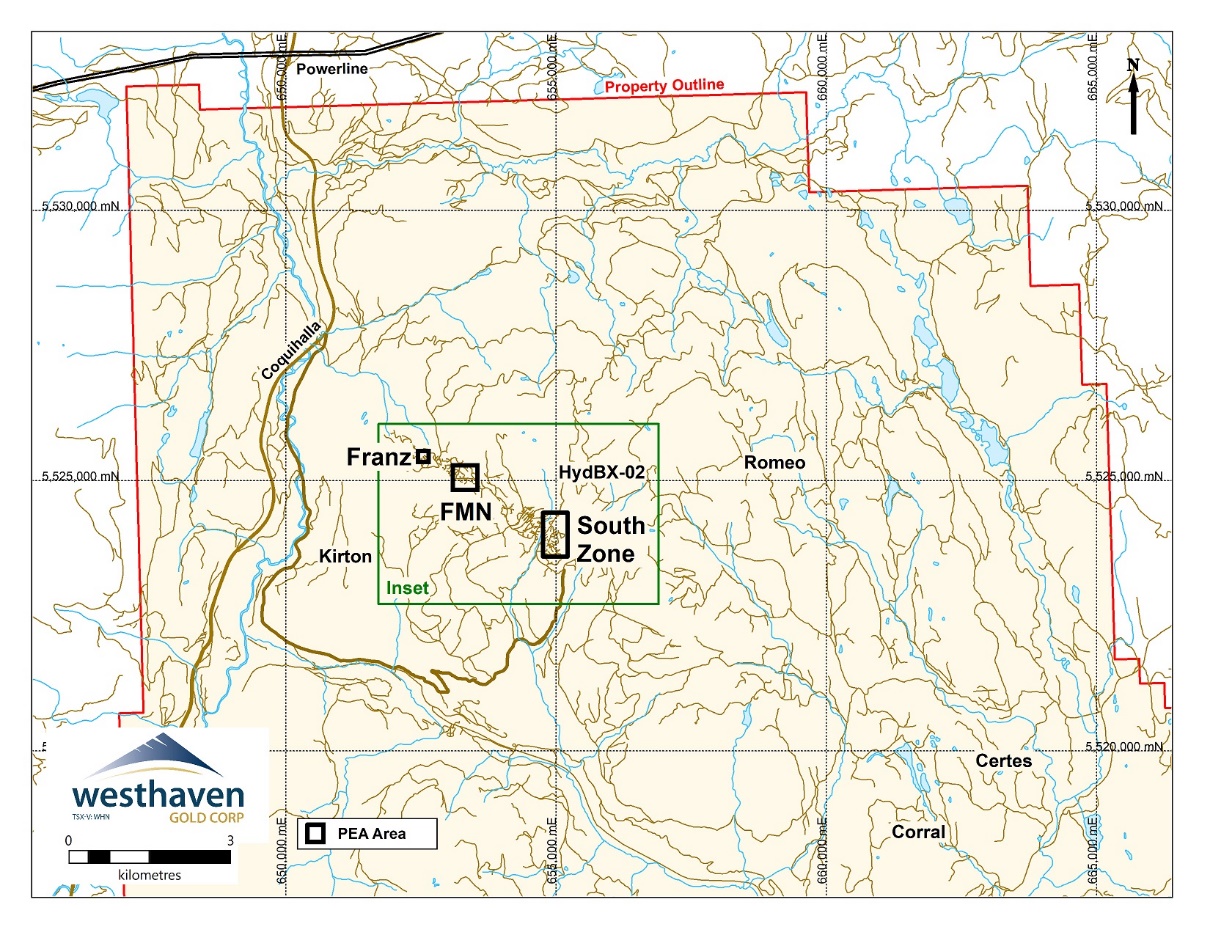
The ~41,634 ha Shovelnose gold property is located near the southern end of the Spences Bridge Gold Belt (SBGB), approximately 30 km south of Merritt, British Columbia. The property is accessible by the Coquihalla Highway (BC Provincial Highway #5) at the Coldwater exit, then by a series of logging roads to the northern and southern portions of the property.
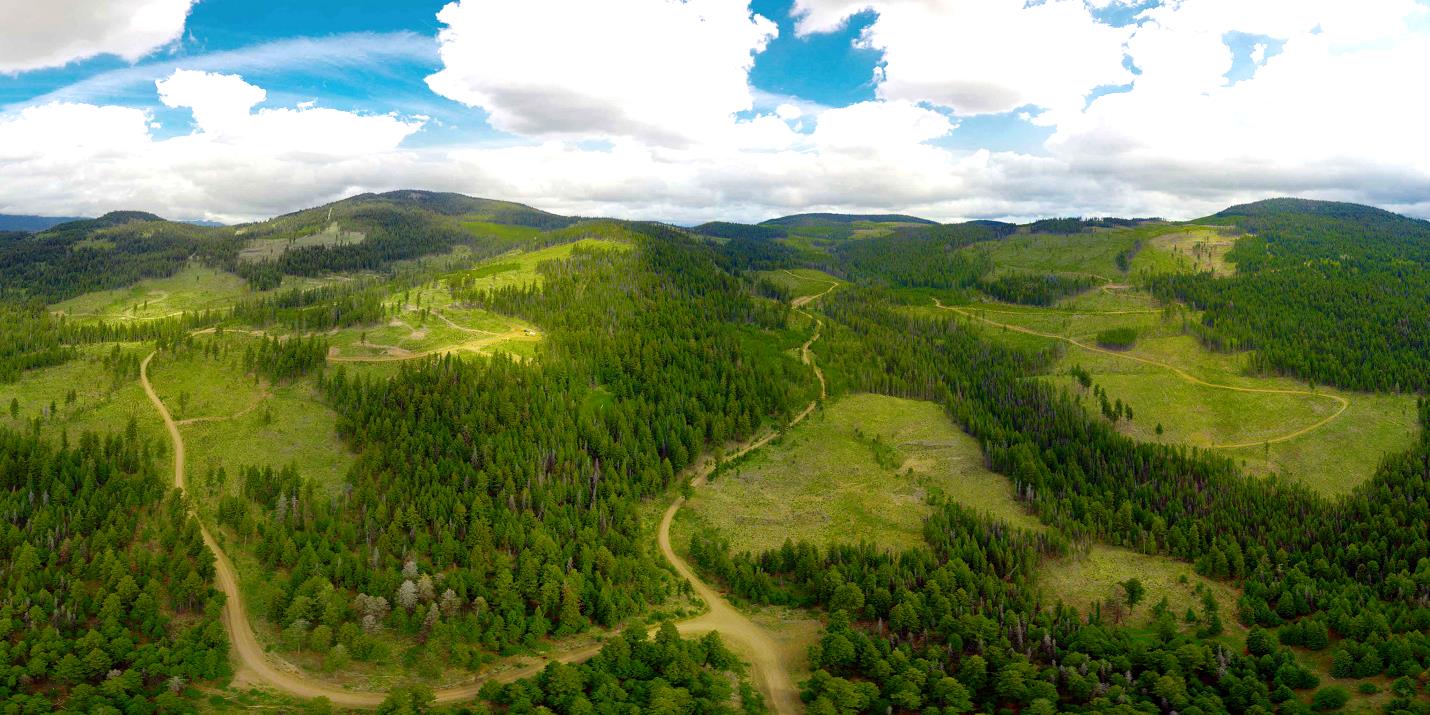
The Shovelnose claims cover prospective stratigraphy in the southern SBGB, a 110 km northwest–trending belt of intermediate to felsic volcanic rocks dominated by the Cretaceous Spences Bridge group. These relatively underexplored volcanic rocks are highly prospective for epithermal style gold mineralization. Low-sulphidation epithermal gold quartz veins occur throughout the range of Spences Bridge Group stratigraphy. Westhaven has a 100% interest in this property subject to a 4% NSR. Westhaven has the option to purchase 1% of the 4% NSR back for C$500,000 up to commercial production and an additional 0.5% for US$3,000,00 for a period of 5 years (commencing Oct 6th, 2022).
Westhaven has drilled approximately 555 holes in over 186,000 metres of diamond drilling since the companies inception in 2011 and approximately $55 million dollars has been spent on exploration and drilling at the Shovelnose Gold Property.
Westhaven Announces Updated Preliminary Economic Assessment for the Shovelnose Gold Project, British Columbia After-Tax NPV Doubled to $454 Million After-Tax IRR of 43.2% Payback of Initial Capital Costs of 2.1 Years
All amounts are in Canadian Dollars unless otherwise noted
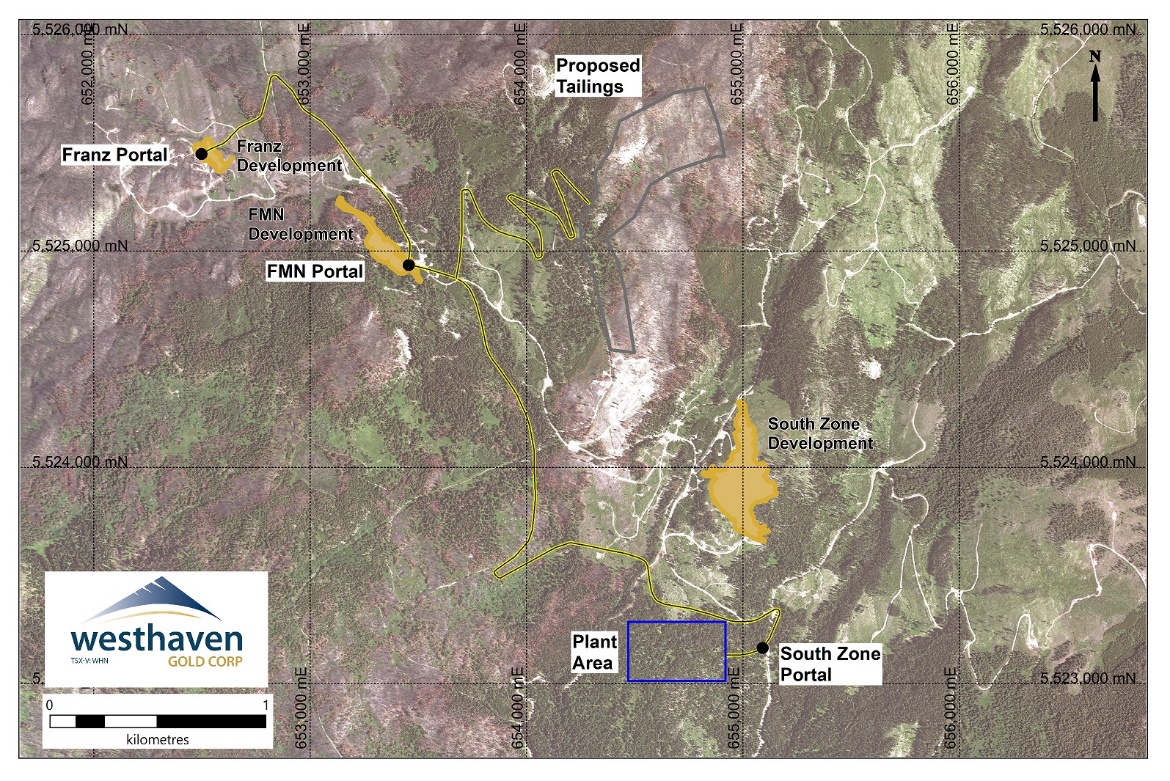
Vancouver, B.C. – March 3rd, 2025 – Westhaven Gold Corp. (TSX-V:WHN) is pleased to report the completion of an Updated Preliminary Economic Assessment (“PEA”) at its 100% owned 41,634-hectare Shovelnose Gold Property (the “Property”) located within the prospective Spences Bridge Gold Belt (“SBGB”), which borders the Coquihalla Highway 30 kilometres south of Merritt, British Columbia. The PEA outlines a robust, low-cost, rapid pay-back, high margin, 11.1 year underground gold mining opportunity and is based on updated mineral resources that includes contributions from the South, Franz and FMN zones.
At a gold price of US$2,400/oz and an exchange rate of C$1.00 to US$0.72, the Shovelnose base case estimate (the "Base Case") generates an after-tax net present value (NPV) at a 6% discount rate of $454 million and an internal rate of return (IRR) of 43.2%. The proposed mine will operate over an initial 11.1 year mine-life with average annual life-of-mine gold production of 56,000 ounces. Initial capital expenditure to fund construction and commissioning is estimated at $184 million, with a life-of-mine capital cost of $379 million and a payback period of 2.1 years. The all-in sustaining costs (as defined per World Gold Council guidelines, less corporate G&A) are estimated to be US$836 per ounce of gold produced.
Summary Table - Economic Sensitivity to Long Term Gold Price
| Long Term Metal Price Variability | Corresponding Gold Price | After Tax NPV (at 6%) | After Tax IRR |
| (percentage change) | US$/ounce | CDN $ millions | (%) |
| - 20% | 1,920 | 284.3 | 30.4 |
| - 10% | 2,160 | 369.1 | 36.9 |
| base case | 2,400 | 453.7 | 43.2 |
| + 10% | 2,640 | 538.3 | 49.5 |
| + 20% | 2,880 | 622.8 | 55.7 |
The Company cautions that the results of the PEA are preliminary in nature and include inferred mineral resources that are considered too speculative geologically to have economic consideration applied to them to be classified as mineral reserves. There is no certainty that the results of the PEA will be realized. Mineral resources that are not mineral reserves do not have demonstrated economic viability.
Preliminary Economic Assessment Highlights:
*Base case parameters of US$2,400 per ounce gold, US$28 per ounce silver and CDN$/US$ exchange rate of $0.72.
*All costs are in Canadian dollars unless otherwise specified.
Robust financial metrics.
- Pre-tax Internal Rate of Return (“IRR”) of 56.3%; After-tax IRR of 43.2%.
- Low All-In Sustaining Cost (“AISC”) of $1,161/ounce (“oz”) (US$836/oz) gold equivalent (“AuEq”).
- Low Cash Cost of $872 oz/AuEq (US$ 628/oz AuEq).
- Pre-tax Net Present Value (“NPV”6%) of $730 million (M) and After-tax NPV of $454M.
- Payback period from start of production year at 1.7 years pre-tax and 2.1 years after-tax.
- After-tax (NPV 6%) increases to $634M and After-tax IRR increases to 56.6% using spot prices of US$2,900 gold and US$30 silver.
Low capital-intensive development and operating costs.
- Total Preproduction Capital of $184M.
- Total Life of Mine (“LOM”) Capital Costs of $379M.
- Average operating cost of $142/ tonne processed.
- 92% of total stope mining is cost effective longitudinal and traverse longhole stoping, with only 8% of total mining requiring cut and fill stoping.
11.1-year mine life and ability to expand processing to accommodate satellite discoveries.
- 718,600 total Indicated ounces gold equivalent (“AuEq”) underground Mineral Resource Estimate.
292,000 total Inferred ounces AuEq underground Mineral Resource Estimate. - Production rate of 1,000 tonnes per day (“tpd”).
- Total payable metals of 637,000 oz gold (“Au”) and 3,562,000 oz silver (“Ag”).
- Average annual production of 56,000 oz Au peaking in year 7 at 68,000 oz Au.
Total mineralized rock production of 4,159,000 tonnes at 5.26 g/t Au and 32 g/t Ag. - Metallurgical recoveries of 91.5% Au and 92.9% Ag.
Community/stakeholder benefits.
- Total projected income taxes paid of $284M.
- Total projected British Columbia mineral taxes paid of $163M.
- More than 130 well-paying local full time jobs created during life of mine.
- Additional employment during construction phase.
- Indirect spin-off benefits during both construction and mine operations.
Mineral Resources, Updated PEA Preparation and Results
The previous public Mineral Resource Estimate (“MRE”) for the South Zone was carried out by P&E Mining Consultants Inc. (“P&E”) with an effective date July 18, 2023. The current underground MRE is reported herein. All drilling and assay data were provided by Westhaven, in the form of Excel data files. The GEOVIA GEMS™ V6.8.4 database compiled by P&E for the February 28, 2025 MRE consisted of 355 surface drill holes, totalling 121,971 metres. A total of 145 drill holes (50,714 metres) were intersected by the Mineral Resource wireframes used in this PEA.
P&E validated the Mineral Resource database in GEMS™ by checking for inconsistencies in analytical units, duplicate entries, interval, length or distance values less than or equal to zero, blank or zero-value assay results, out-of-sequence intervals, intervals or distances greater than the reported drill hole length, inappropriate collar locations, survey and missing interval and coordinate fields. Some minor errors were identified and corrected in the database. The QPs are of the opinion that the supplied database is suitable for Mineral Resource estimation.
Block models were constructed using GEOVIA GEMS™ V6.8.4 modelling software and consist of separate model attributes for estimated Au, Ag and AuEq grade, rock type (mineralization domains), volume percent, bulk density, and classification. The Mineral Resource was classified as Indicated and Inferred based on the geological interpretation, variogram performance and drill hole spacing. The QPs also consider mineralization at the South, Franz and FMN Zones to be potentially amenable to underground mining methods. The revised MRE used for this Updated PEA is reported with an effective date of February 28, 2025 and is tabulated in Table 1.
| Table 1 Shovelnose Underground Mineral Resource Estimate @ 1.3 g/t AuEq Cut-off (1-7) |
||||||||
| Classification | Zone |
Tonnes (k) |
Au (g/t) |
Contained Au (k oz) |
Ag (g/t) |
Contained Ag (k oz) |
AuEq (g/t) |
Contained AuEq (k oz) |
| Indicated | South | 3,107 | 6.18 | 616.8 | 33.1 | 3,302.8 | 6.56 | 655.2 |
| Franz | 89 | 7.44 | 21.2 | 30.9 | 88.0 | 7.80 | 22.2 | |
| FMN | 241 | 5.07 | 39.2 | 22.5 | 173.7 | 5.33 | 41.2 | |
| Total | 3,437 | 6.13 | 677.2 | 32.3 | 3,564.5 | 6.50 | 718.6 | |
| Inferred | South | 1,386 | 3.79 | 168.6 | 16.5 | 736.8 | 3.98 | 177.2 |
| Franz | 63 | 3.48 | 7.1 | 51.9 | 105.4 | 4.09 | 8.3 | |
| FMN | 843 | 3.49 | 94.6 | 37.5 | 1,017.3 | 3.93 | 106.5 | |
| Total | 2,292 | 3.67 | 270.3 | 25.2 | 1,859.5 | 3.96 | 292.0 | |
1. Mineral Resources that are not Mineral Reserves do not have demonstrated economic viability.
2. The estimate of Mineral Resources may be materially affected by environmental, permitting, legal, title, taxation, socio-political, marketing, or other relevant issues.
3. The Inferred Mineral Resource in this estimate has a lower level of confidence than that applied to an Indicated Mineral Resource and must not be converted to a Mineral Reserve. It is reasonably expected that the majority of the Inferred Mineral Resource could potentially be upgraded to an Indicated Mineral Resource with continued exploration.
4. The Mineral Resources were estimated in accordance with the Canadian Institute of Mining, Metallurgy and Petroleum (CIM), CIM Standards on Mineral Resources and Reserves, Definitions (2014) and Best Practices Guidelines (2019) prepared by the CIM Standing Committee on Reserve Definitions and adopted by the CIM Council.
5. PEA is preliminary in nature and includes Inferred Mineral Resources that are considered too speculative geologically to have the economic considerations applied to them that would enable them to be classified as Mineral Reserves, and there is no certainty that the PEA will be realized.
6. The AuEq cut-off of 1.3 g/t was derived from costs of C$82/t mining, C$42/t processing and $18/t G&A. A USD:CDN exchange rate of 0.72 along with US$2,400/oz Au and US$28/oz Ag with respective process recoveries of 91.5% and 92.9%.
7. The Au/Ag ratio used was 86:1.
A financial model was developed to estimate the Life of Mine (“LOM”) plan and considered only underground mining of Mineral Resources at the South, Franz and FMN Zones. Other known gold-silver mineralization at the Shovelnose Gold Property, currently being evaluated by Westhaven, are not included.
The LOM plan covers a 13.1-year period (2 years pre-production and 11.1 years of production). Currency is in Q1 2025 Canadian dollars unless otherwise stated. Inflation has not been considered in the financial analysis.
The Updated PEA outlines a production mine life of 11.1 years with average annual production of 56,000 ounces gold and 312,000 ounces silver at average respective cash costs and all-in sustaining costs ("AISC") per ounce gold equivalent of $1,161(US$836). The PEA considers the payable recovery of 637,000 oz gold and 3,562,000 oz silver from an underground operation, at average respective mine production grades of 5.26 g/t and 32 g/t.
SHOVELNOSE gold PROPERTY (drilling highlights)
2025 summer exploration activities have begun on all four of the company’s gold projects covering 61,512 hectares of the prospective Spences Bridge Gold Belt. Current field work includes prospecting, mapping, and geochemical sampling, with a 3,000m exploration drill program, testing exploration targets at Shovelnose (expected to start drilling in June).
2025 Regional Exploration of the Spences Bridge Gold Belt Properties
Field exploration activities are well underway at Westhaven’s Skoonka North, Skoonka and Prospect Valley properties. All three properties host low-sulphidation epithermal gold-silver mineralisation and significant potential for new discoveries based on the presence of favourable host rocks, prominent structures conducive to fluid migration, mineralized float boulders, anomalous stream sediment and gold-in-soil anomalies, and prominent multi-element pathfinder halos within exposed and drilled bedrock samples.
Shovelnose discovery history:
In late 2017, Westhaven discovered a significant gold-bearing vein system, the South Zone. In 2018, we completed 22 holes for a total 8,613 metres of diamond drilling. In 2019, 49 holes for 21,849 metres was drilled.
Significant Drill Intercepts from 2018 to 2022
-
SN18-12: 1.65m of 175.00 g/t Au and 249.00 g/t Ag
-
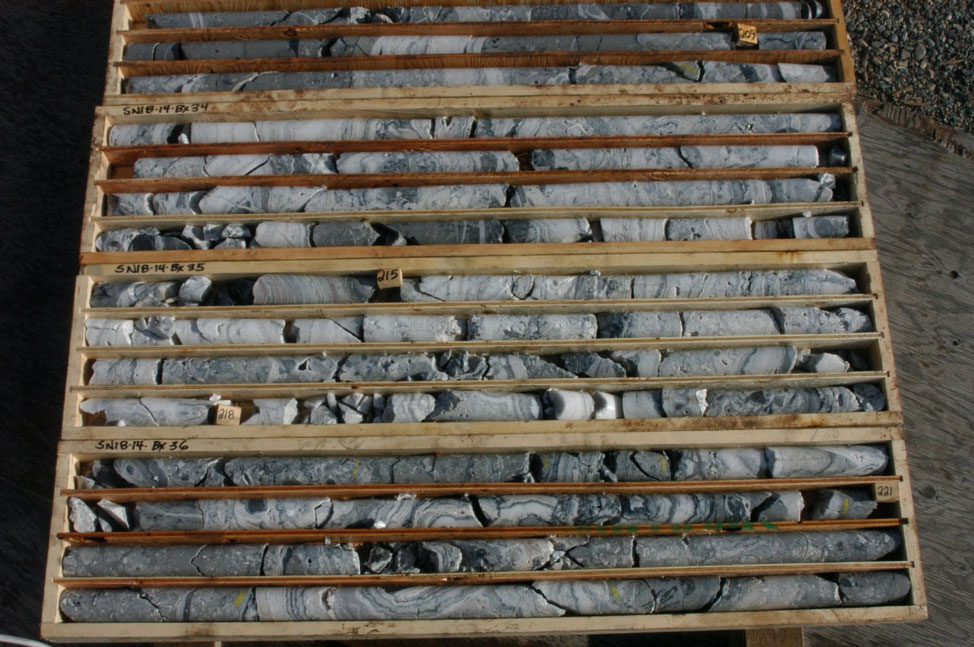
SN18-14: 17.70m of 24.50 g/t Au and 107.92 g/t Ag
-
SN18-15: 46.90m of 8.95 g/t Au and 65.47 g/t Ag
-
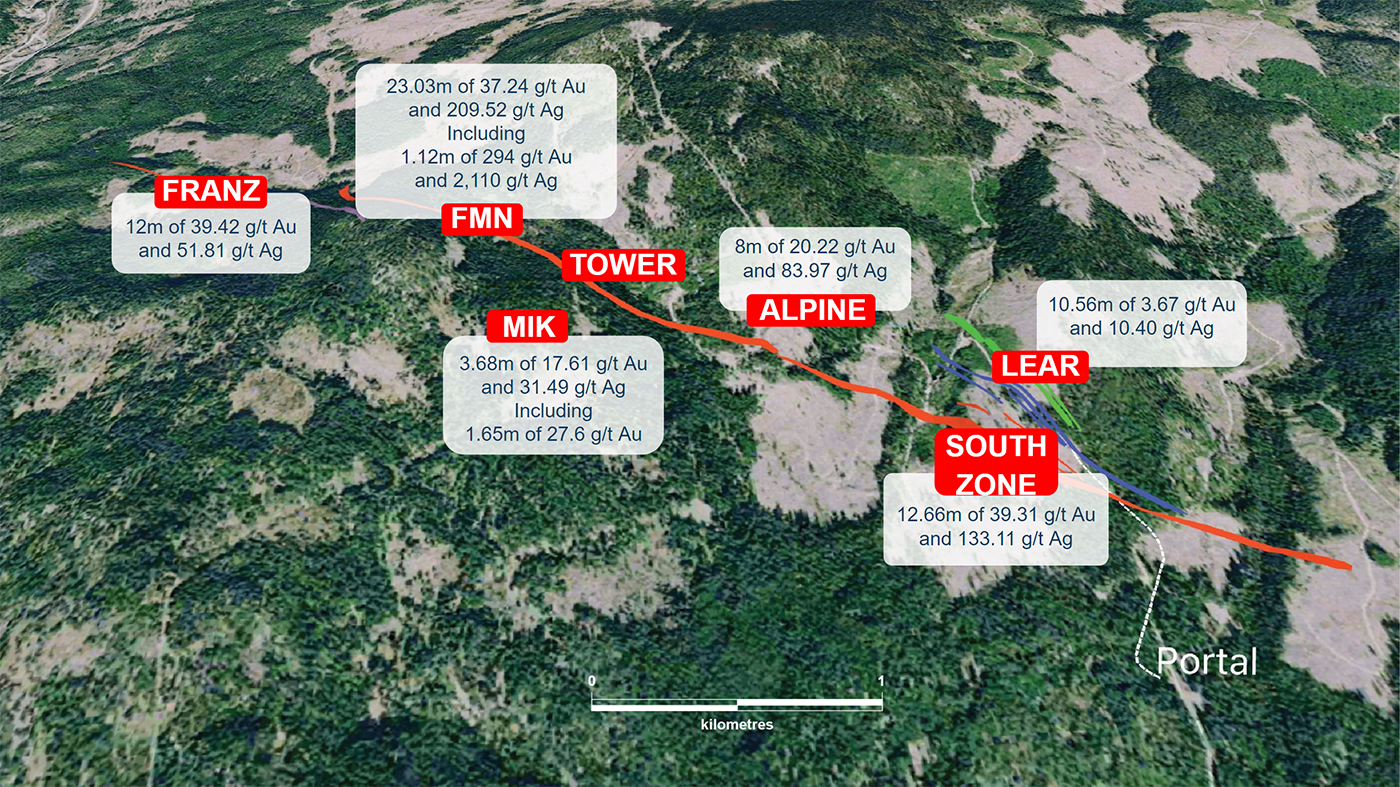
SN19-01: 12.66m of 39.31 g/t Au and 133.11 g/t Ag
-
SN19-10: 18.50m of 11.39 g/t Au and 40.21 g/t Ag (Vein Zone 2)
-
SN19-11: 1.00m of 557.00 g/t Au and 381.00 g/t Ag
-
SN19-15: 7.11m of 9.42 g/t Au and 69.36 g/t Ag (Vein Zone 3)
-
SN20-101: New Discovery (Franz Zone) 7.78m of 14.84 g/t Au and 39.40 g/t Ag. at surface
-
SN21-161: New Discovery (FMN Zone) 15.97m of 9.15 g/t Au and 27.43 g/t Ag
-
SN22-212: (FMN Zone) 23.03m of 37.24 g/t Au and 209.52 g/t Ag
-
SN22-211: (FMN Zone) 36m of 3.74 g/t Au and 20.49 g/t Ag
-
SN22-229: (FMN Zone) 14.96m of 5.69 g/t Au and 343.57 g/t Ag
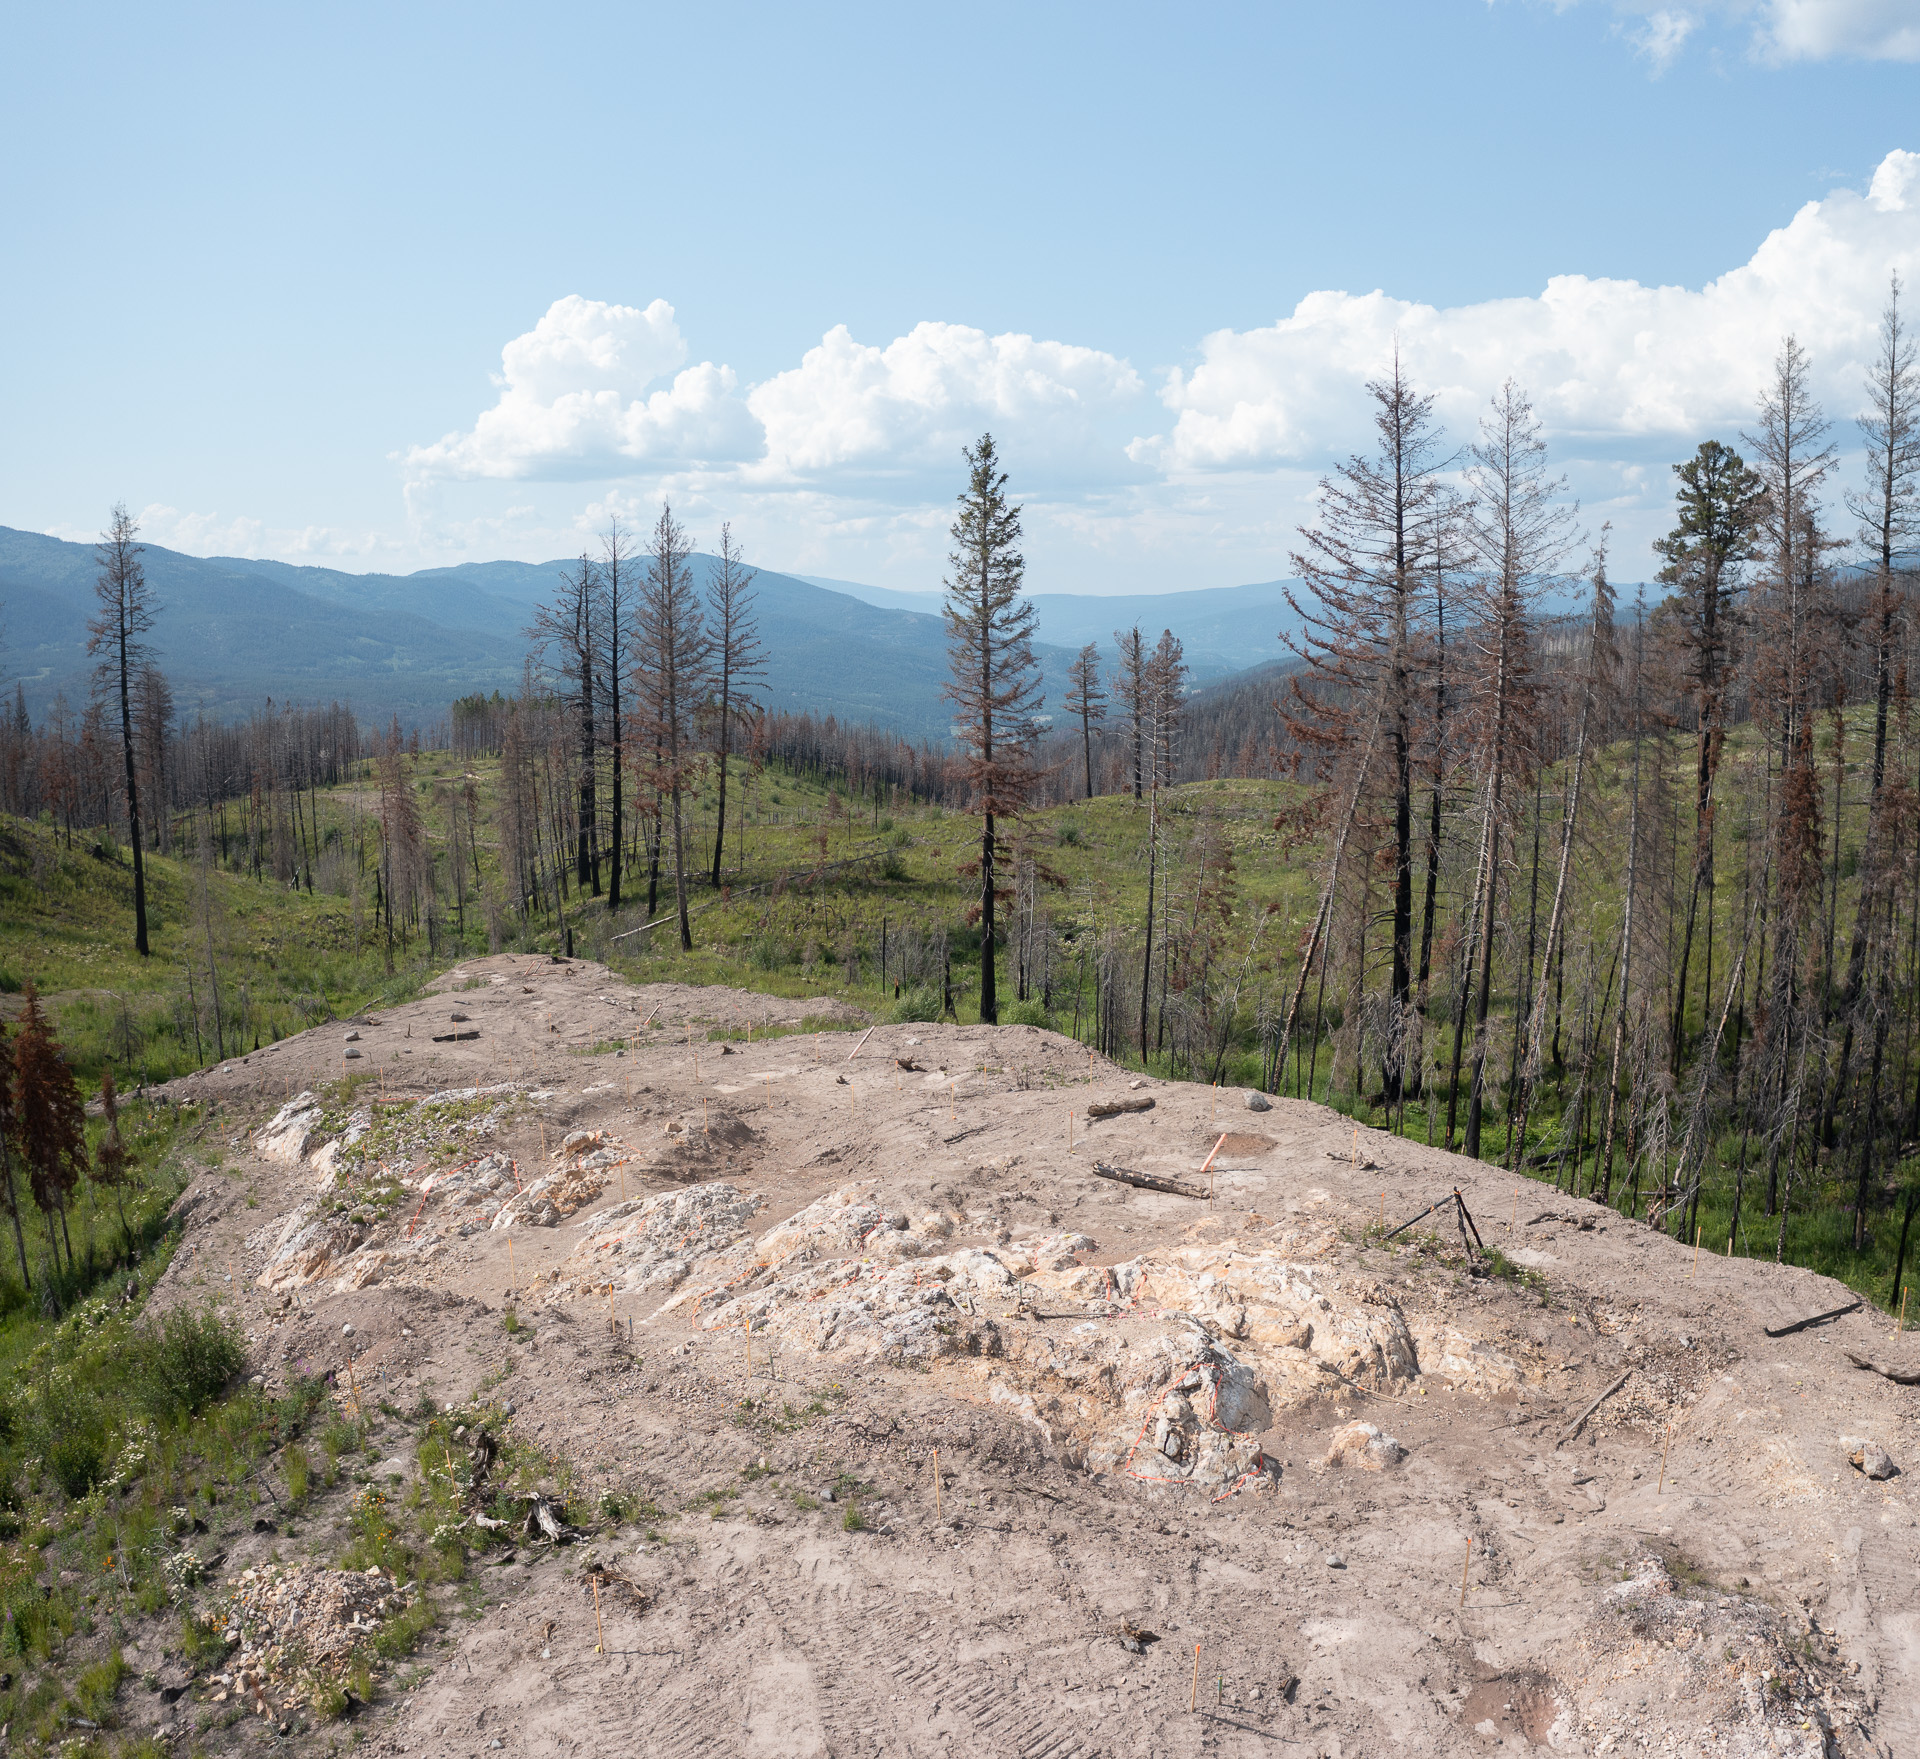
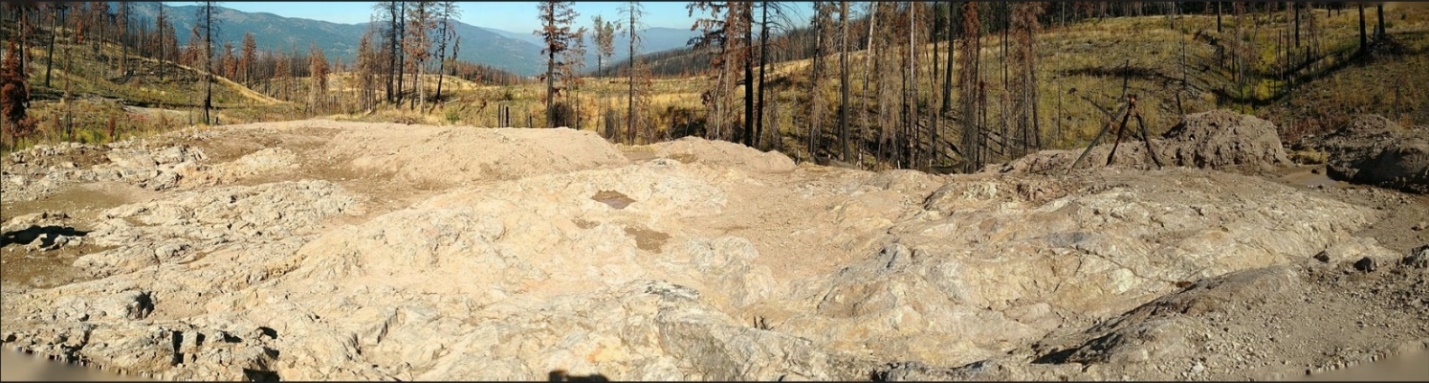
- SN22-333: (Franz Outcrop) 12m of 39.42 g/t Au including 6.2m of 73.51 g/t Au
Picture of the Franz Outcrop looking northwest
Discovery Hole SN18-14: Zone of quartz-adularia veining assaying 24.5 g/t Au, 107.9 g/t Ag over 17.77m. Strongly banded interval in bottom core box returned 50.8 g/t Au and 203.5 g/t Ag over 6.78m (218.0-224.78m).
History
Between the 19th and 20th centuries the discovery of placer gold 75 km to the northwest of Shovelnose ignited the Fraser and Thompson Rivers gold rush (Balon, 2005). Placer gold was mined from gravel bars on major tributaries in the Ashcroft-Lytton-Lillooet district. In particular, the Nicoamen River, located 23 km northwest from Shovelnose Mountain, played a role in initiating the gold rush in the Merritt region.
In 2011, Westhaven Gold Corp. acquired an option on the Shovelnose gold property from Strongbow Exploration Inc. In the same year Westhaven completed a program including soil (972) sampling, stream silt (28) sampling, rock grab (107) and rock chip (91) sampling, mechanical trenching (146.5 m), and diamond drilling 606m in 7 holes). Drilling tested the Mik (3 holes), Line 6 (3 holes) and Tower (1 hole) showings.
In 2012 Westhaven completed 5.8 line-kilometres (3 lines) of reconnaissance-scaled Induced Polarization and ground magnetic geophysical surveys in the vicinity of the Tower, Mik, and Line 6 showings. Follow-up diamond drilling consisted of 5 holes totaling 778.5 metres. The 2012 drill program tested the Tower zone (holes SN-12-02, 03, and 04), intersecting a zone of intensely silicified, limonite stained rhyolite tuff with pyritized grey chalcedonic quartz flooding. Gold mineralization was encountered in all five drill holes, however, the Tower zone appears to host the largest consistent near surface gold mineralization discovered on the Property to date.
Hole SN-12-04 intersected 106.5 m of very highly silicified breccias with original lithologies and textures mostly obliterated due to the intense silica flooding. Within the 106.5 m long zone of silicification a 53.5 m long zone containing dark grey to black pyritiferous breccia matrix accounted for most of the gold mineralization grading 0.51 g/t Au; 4.6 g/t Ag.
In 2013 Westhaven completed programs consisting of prospecting, geophysical Induced Polarization and ground magnetic geophysical surveys (3.75 line-km on 5 lines) and diamond drilling (8 holes totaling 1,043.0 metres) in the Tower zone area. The main focus of the 2013 drill program was to test extensions of mineralization at the Tower zone.
In 2014 Westhaven completed 6 diamond drill holes totaling 662.5 metres. The drill program was designed to test for extensions and the potential for a possible feeder zone bearing higher grading gold mineralization below or along strike to SN-12-04. One hole was drilled in the MIK showing to possibly undercut gold mineralization discovered during the 2011 drill program.
In 2015 Westhaven completed an airborne Light Detection and Ranging Survey (LIDAR) over an area of 19.5 km2, Induced Polarization (12.75 line-kilometres), VLF-EM (54.94 linekilometres),and ground magnetic (23.45 line-kilometres) geophysical surveys. The most significant discovery was the Alpine showing, a northwesterly trending, moderate intensity resistivity anomaly coincident with a moderate intensity chargeability anomaly, located approximately 450 metres east of the Tower zone that has been defined over a strike length of 1 kilometre. Follow-up diamond drilling consisting of 5 holes totaling 1,408 metres drilled in the Line 6 (2 holes), Tower (2 holes), and Alpine (1 hole) zones.
In 2016 Westhaven completed 9 diamond drilling holes totaling 1,902 metres. Three holes were drilled into the Tower zone in an attempt to ascertain the geometry of possible feeder zones to the upper lower-grading gold mineralized tuffs and six holes tested the Alpine Zone IP chargeability anomaly.
In 2017 a ground magnetics survey was completed over the Tower and Alpine Zones. A northeast trending linear magnetic low was noted truncating the southern extent of the chargeability anomaly.
Drillholes 17-06 and 17-07 targeted the linear magnetic anomaly (Figure 6). Drillhole 17-06 (Az 110°, Dip -50°) was collared 210 metres southwest of drillhole SN16-02. Drilling intersected an upper unit of silicified rhyolite tuff to 266 metres depth, underlain by heterolithic, welded, and rhyolite tuffs to 447 metres depth which were underlain by andesites and basalts to 506 metres depth. Although west dipping quartz veining was noted from bedrock surface to 477 metres depth, gold mineralization was most prominent within the upper rhyolite tuffs averaging 0.52 g/t Au and 1.4 g/t Ag over 85.0 metres (Figure 11). Within this zone higher grading intervals include 1.02 g/t Au and 2.5 g/t Ag over 17.0 metres.
Drillhole 17-07 (Az 110°, Dip -50°) was collared 120 metres northeast of 17-06. Drilling intersected silicified rhyolite tuffs from bedrock surface to 293 metres depth, underlain by heterolithic tuffs to the end of the hole at 431 metres depth (Figure 12). Numerous steeply dipping basalt dykes were intersected near the bottoms of both 17-06 and 17-07. Similar to 17-06, west dipping quartz veining was noted throughout the hole and gold mineralization was most prominent within the near surface silicified rhyolite tuffs averaging 0.29 g/t Au and 1.1 g/t Ag over 101.0 metres. Within this area higher grading zones include 2.48 g/t Au and 5.4 g/t Ag over 5.7 metres.